about the product
Fulcrum is a placement platform. Students use it to build resumes, practise tests, and take AI interviews. This project is the college side, where a placement team sets up that preparation for a whole batch and keeps its placement records in one place.
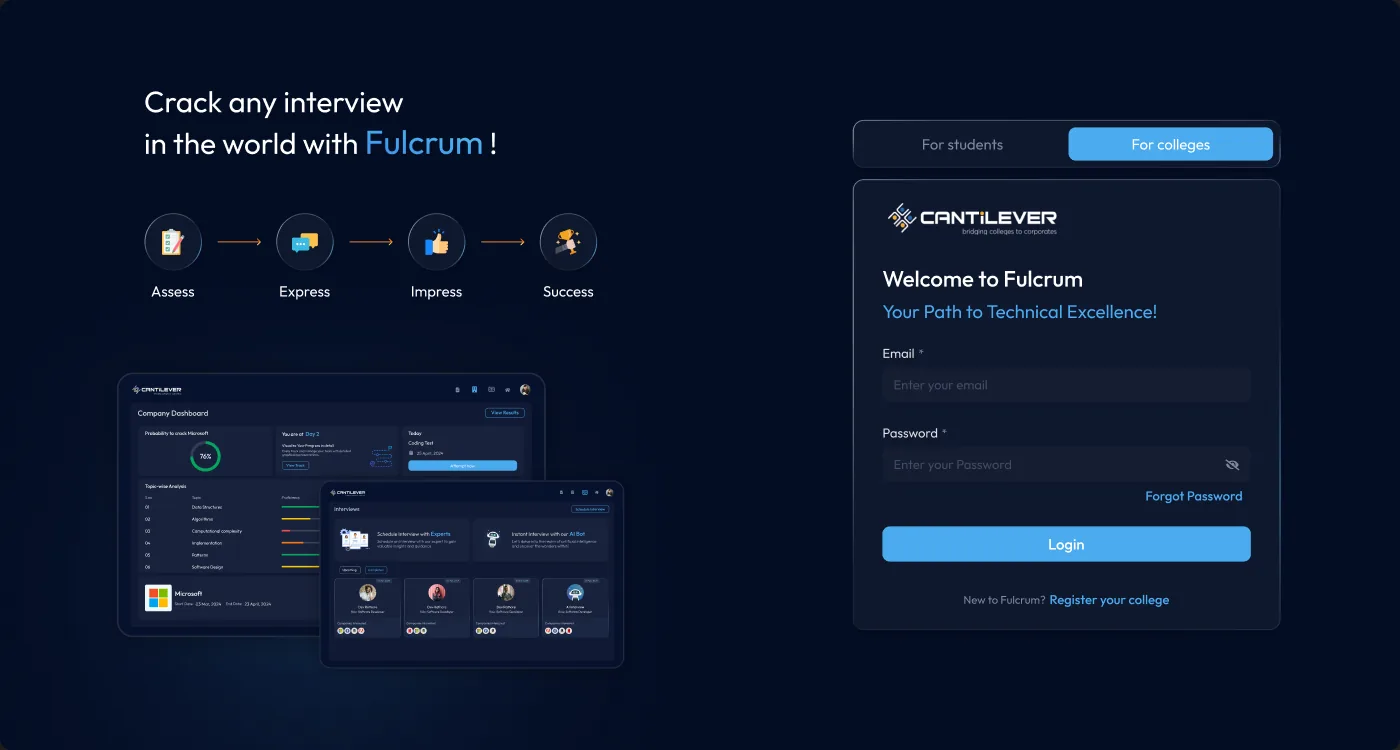
Fulcrum was built for students, but colleges were the ones adopting it, with no bridge from the college to its students inside the product.
How might we give colleges one place to assign real, company-specific preparation to their students, and track their readiness?
a gap between the college and the product
Fulcrum already had a student product. The college side had to solve two problems at once: the daily work of running placements, and a business gap between what colleges needed to see and what the student product could give them.
A placement cell was running a whole batch on spreadsheets, shared documents, and message threads. Student details, resume status, test results, and offers each sat in a different file, updated by hand.
There was no reliable way to see who was prepared and who was falling behind.
With the student product ready, colleges wanted one place to see readiness across the batch: how many students had a resume, how many were interview ready, how many had cleared their tests, and who needed more preparation.
They also wanted to set up placement tracks for real roles and send them straight to students, without leaving the dashboard.
The gap sat between the two. Colleges held the students and the company drives, and Fulcrum held the preparation. This dashboard closes that gap. It gives a college a clear view of resume, test, and interview readiness, and a direct bridge into Fulcrum, so a placement team can assign a track for a role and have students prepare for it inside the product they already use.
What it makes visible to a college and its recruiters
-
01
How many students have built a resume, and how many have finished.
-
02
How many are interview ready, and how many need more practice.
-
03
How many have cleared their tests for a given role.
-
04
Who needs extra preparation before a company drive.
mapping the two sides
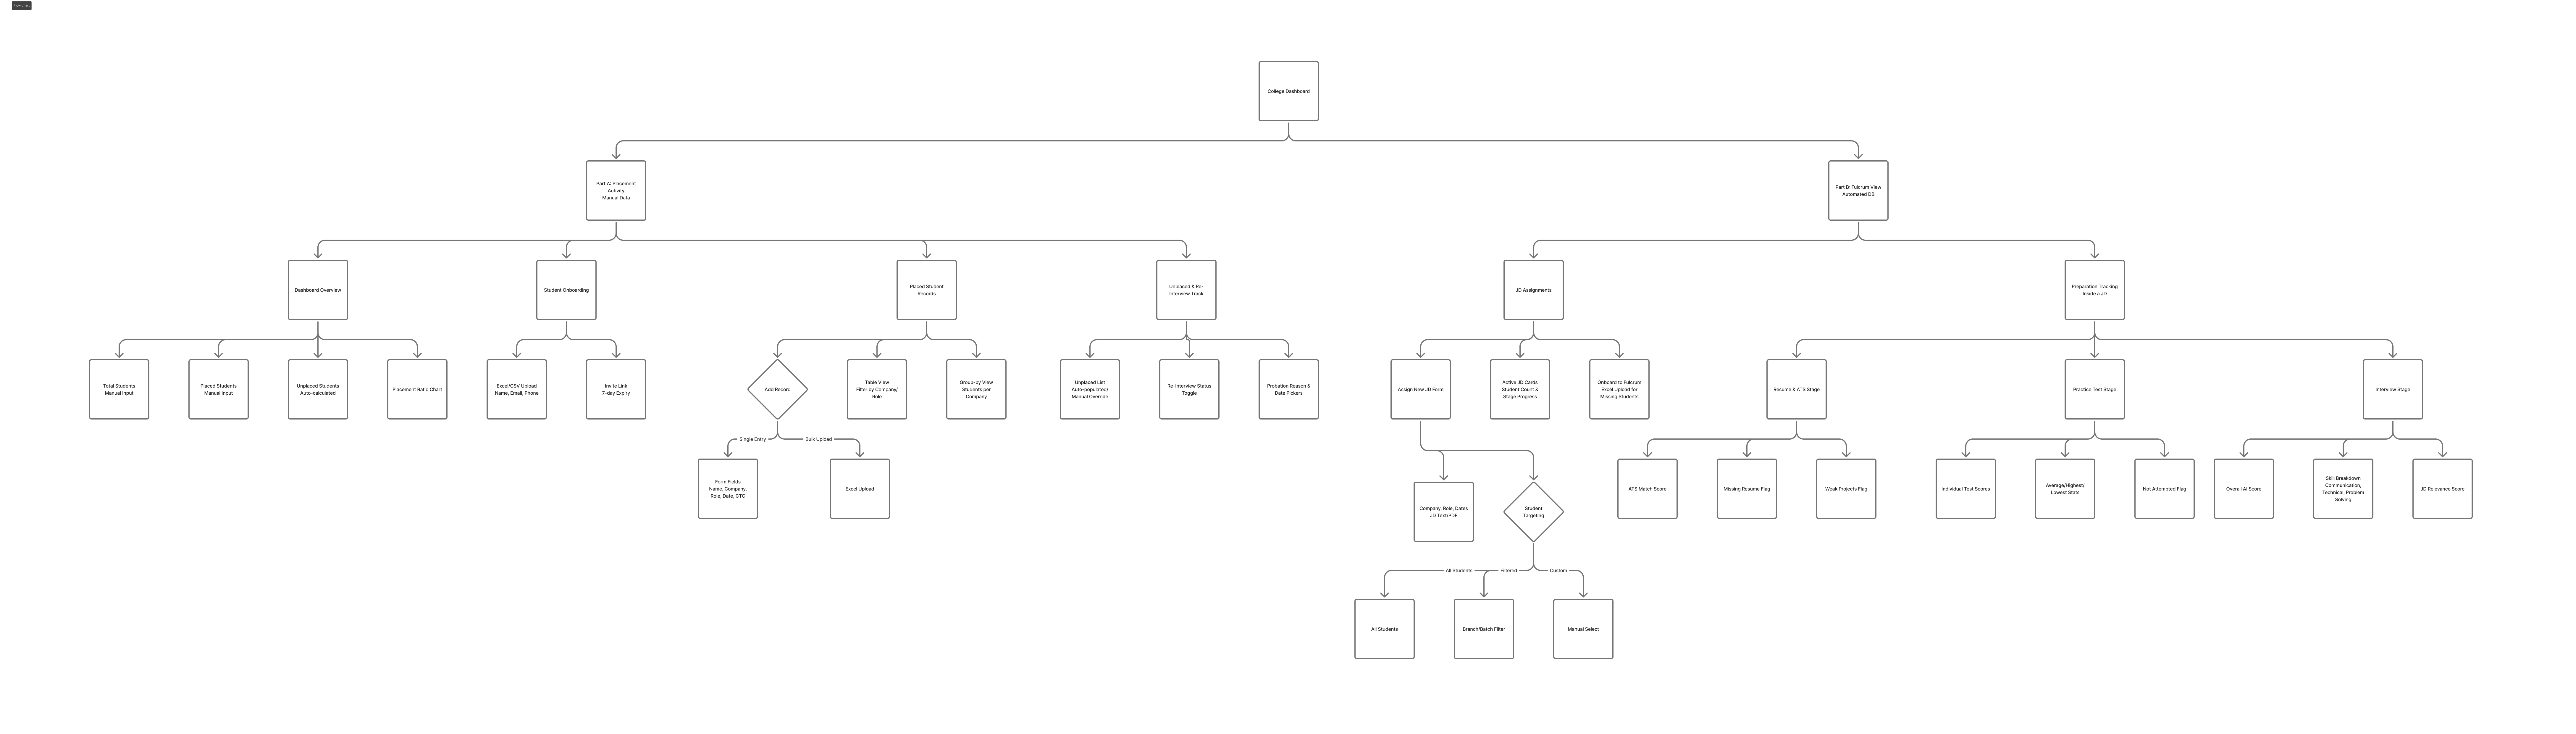
An early information architecture, splitting the product into two halves: the college's own placement activity, and a live view into Fulcrum, where a college assigns real-role preparation and tracks how students move through it.
what shaped the design
A few constraints set the direction, and each carried a trade-off.
-
01
It had to sit on the existing Fulcrum platform. The college side shares data and sign in with the student product, so the bridge could not be a separate silo.
-
02
It had to ship quickly. I built on a ready design system instead of a custom one, trading bespoke visuals for speed and a consistent result.
built for fast delivery
To meet the delivery constraint, the interface uses the shadcn design system with Tailwind CSS colours, plus a few custom components. That kept design and build fast and consistent across every screen.
everything about the batch in one view
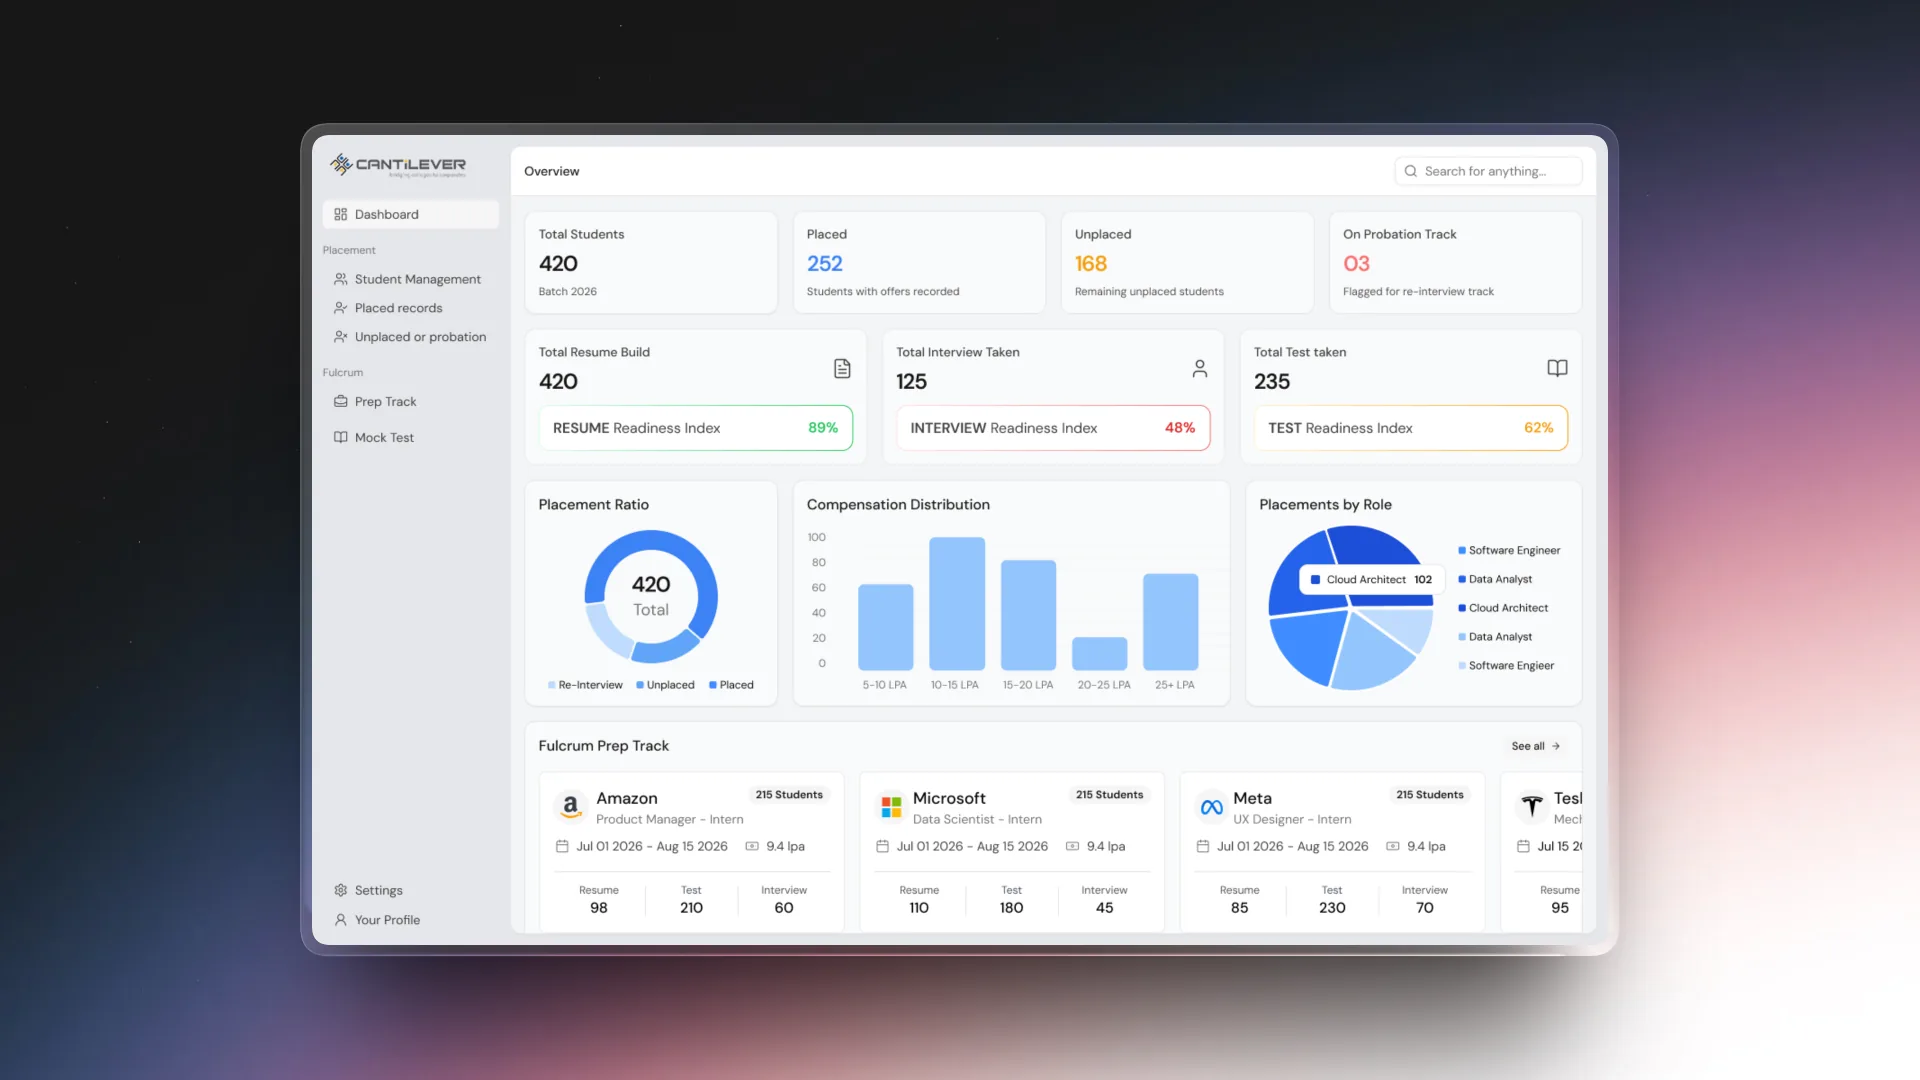
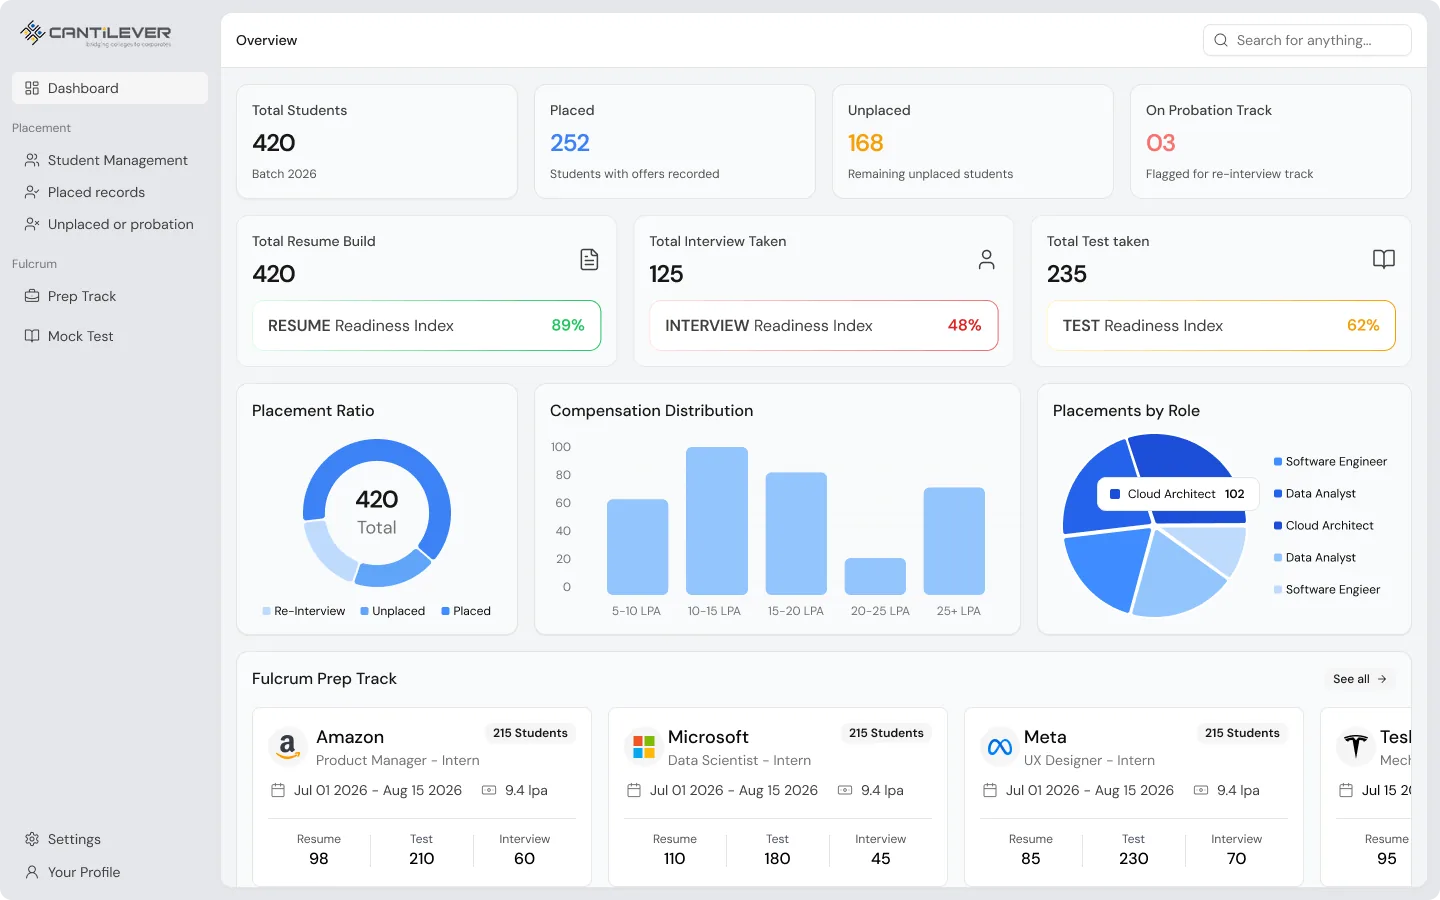
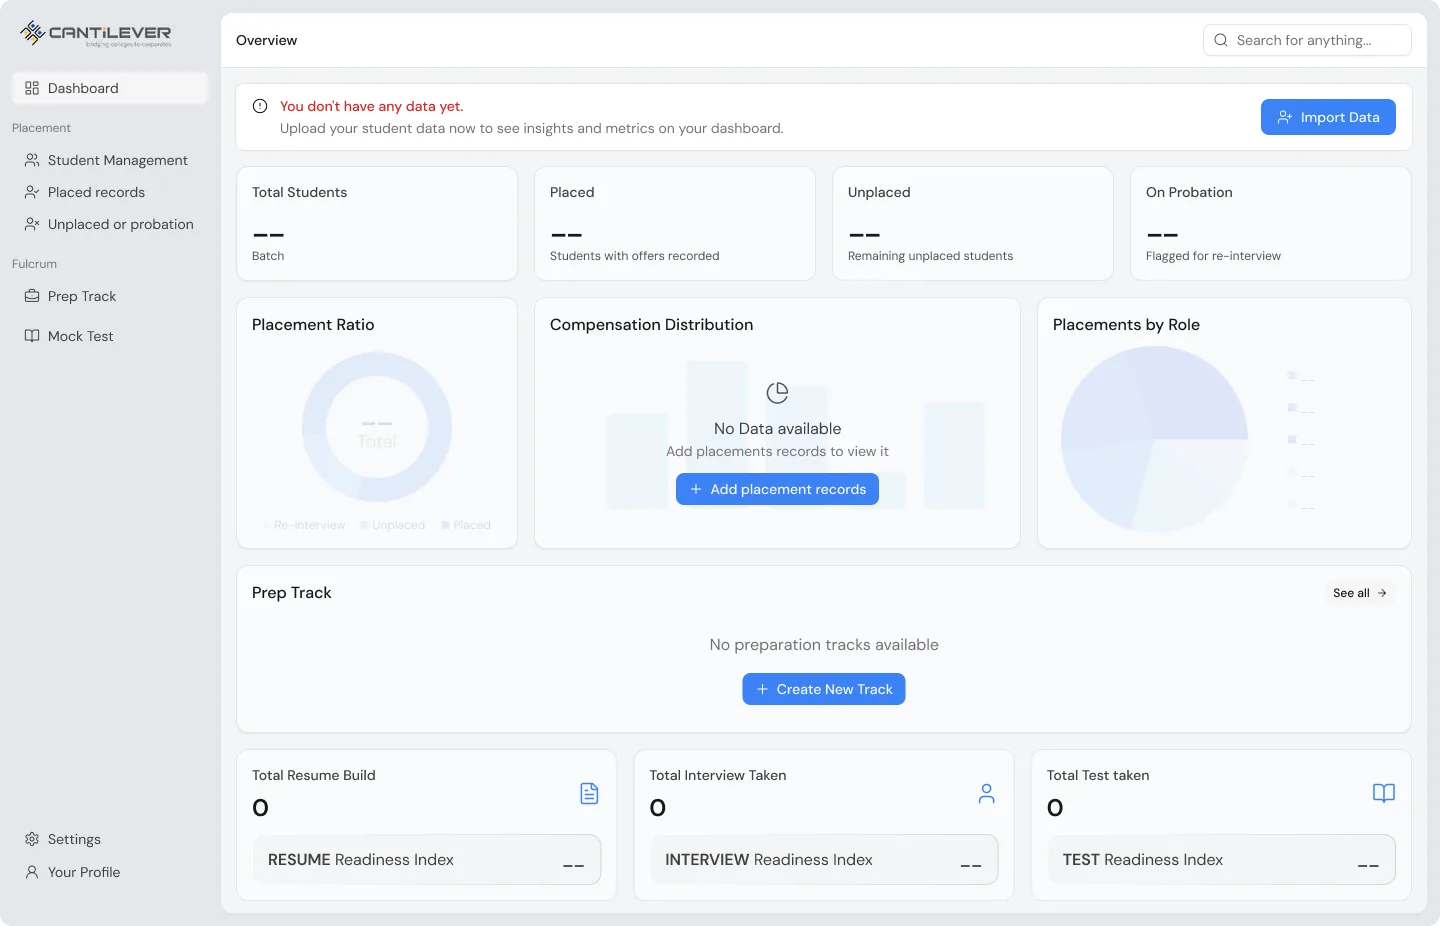
The overview is the home of the product. It pulls the whole batch into one screen: how many are placed, how ready they are, where offers are landing, and which tracks are running.
-
01
Batch at a glance: total, placed, unplaced, and the re-interview track.
-
02
Readiness: resume, test, and interview readiness across the batch.
-
03
Outcomes: placement ratio, compensation spread, and placements by role.
-
04
Live tracks: the active company tracks and their progress.
preparing against a real role
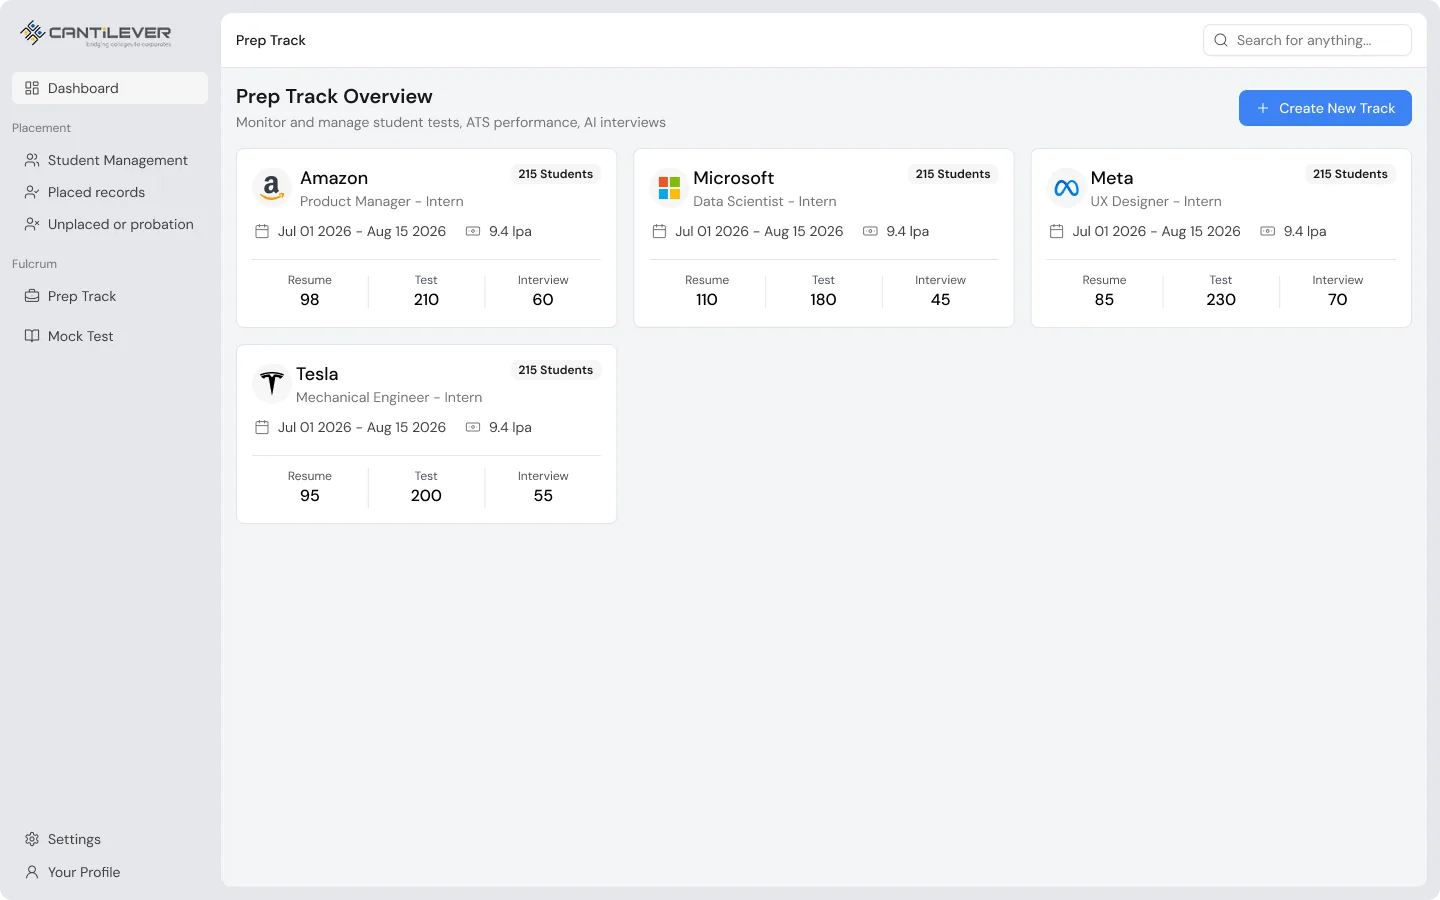
A placement team builds a track for a company and role, then follows how the assigned students move through it.
-
01
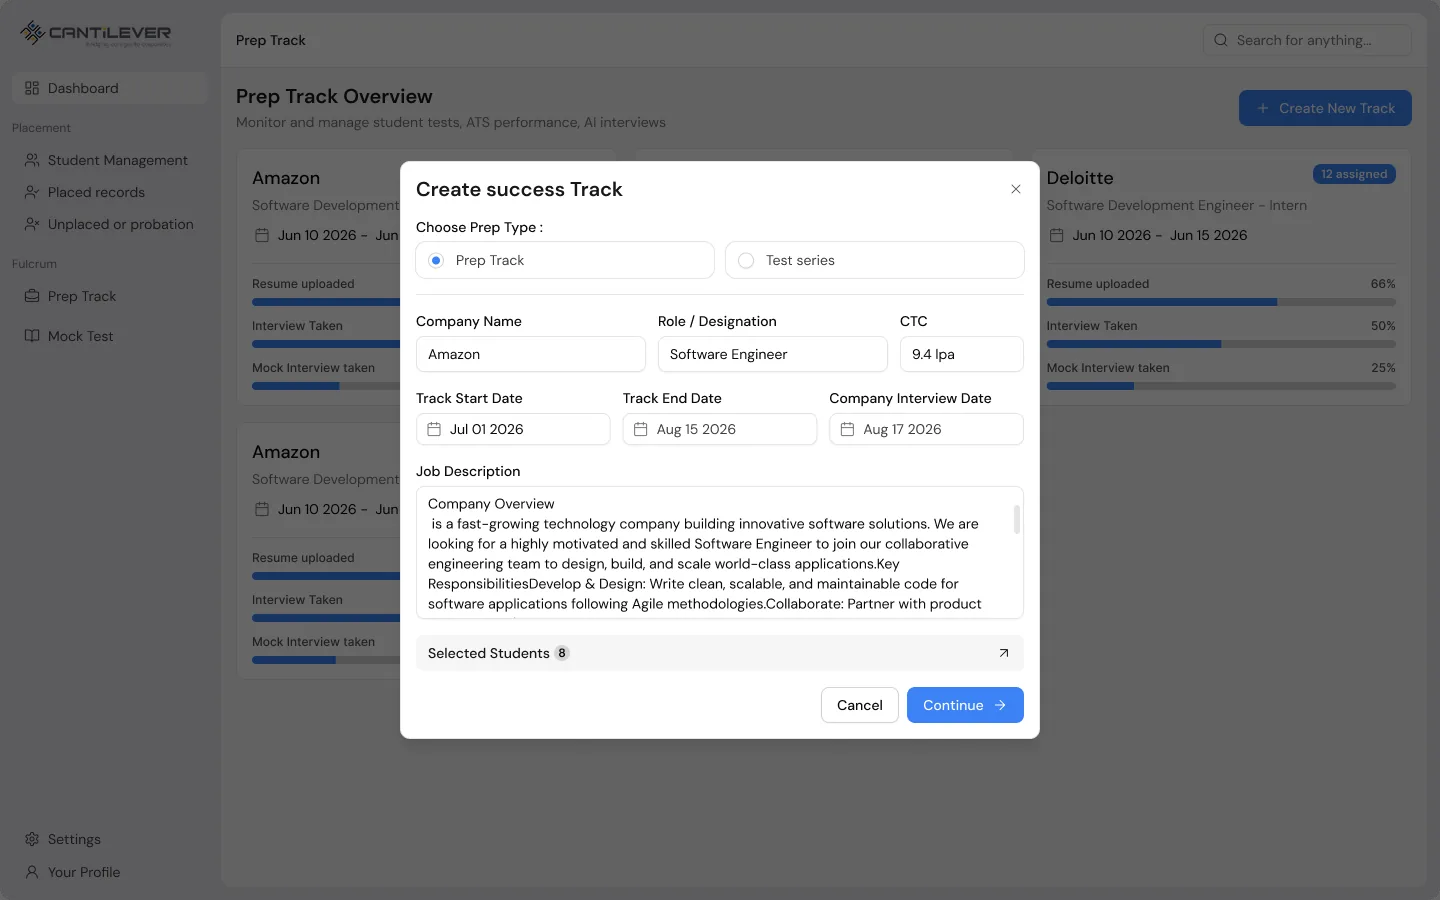
Create a track
Add the company, role, and job description.
-
02
Assign students
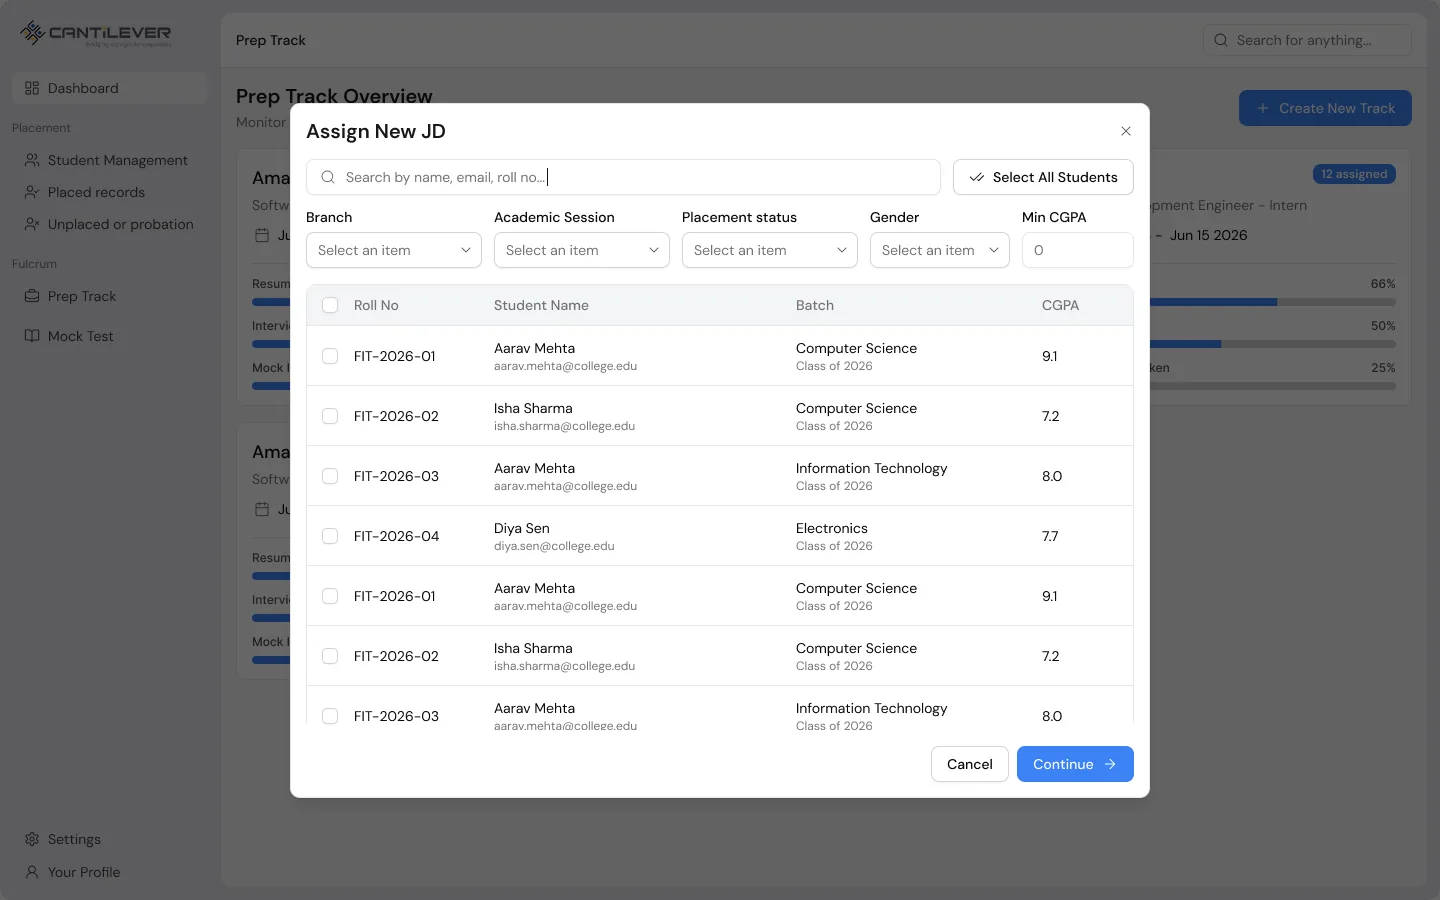
Everyone, a branch, or a chosen list.
-
03
Students prepare
Resume and ATS, a practice test, and an AI interview.
-
04
Progress returns
Each result shows up on the track.
from a job description to a group
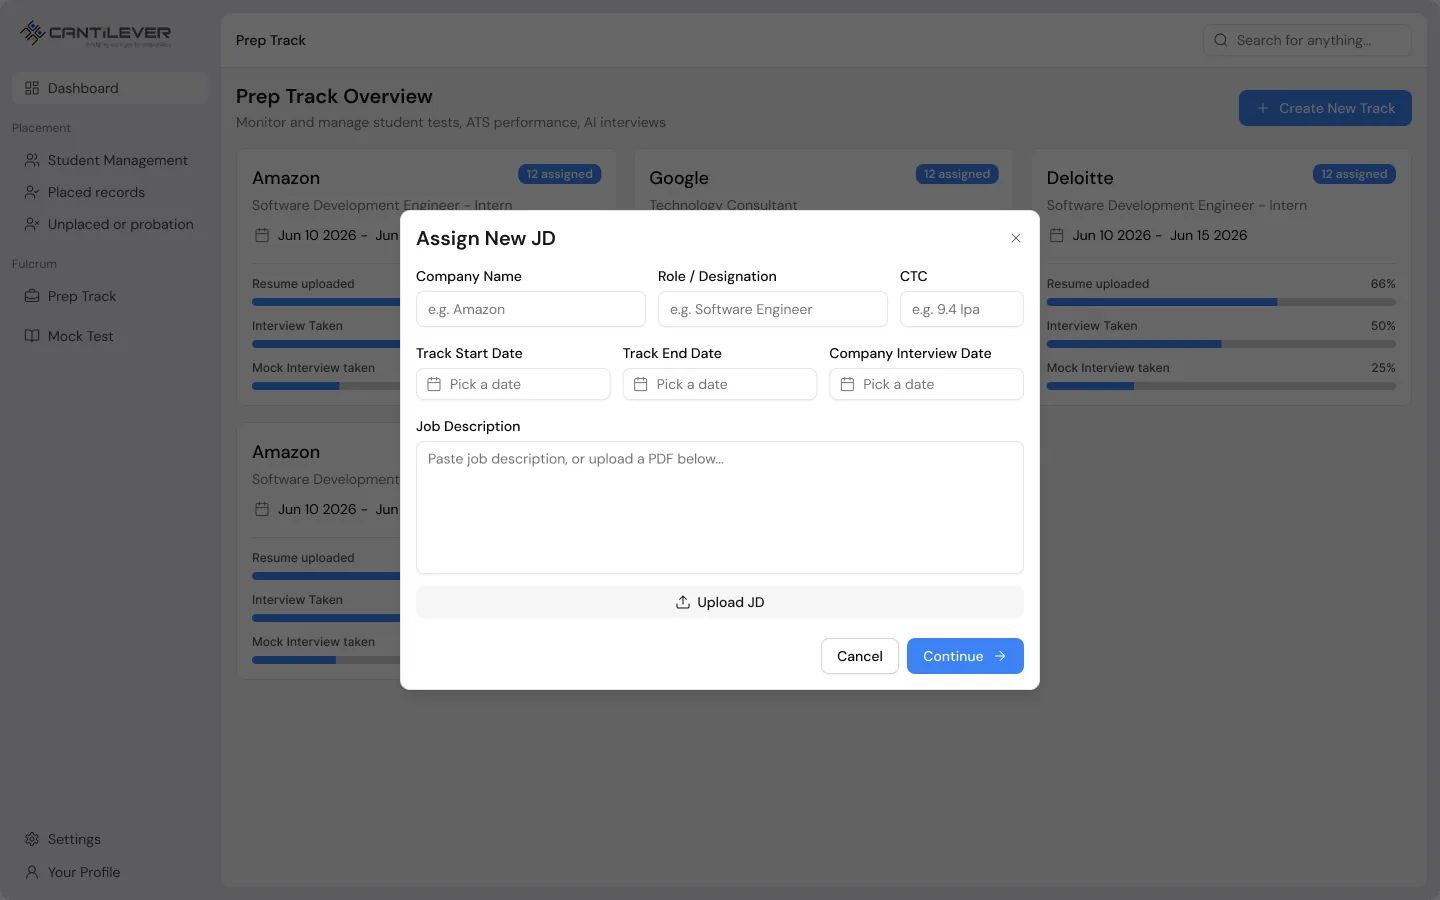
A track starts from a real job description. The team adds the role, pastes or uploads the JD, sets the dates, then chooses who it is for.
connected to the student portal
This dashboard and the student app are one platform. A track the college creates here is sent straight to the students' portal, and what the students do there flows back to this dashboard.
When the college assigns a prep track, it appears in each assigned student's account in the Fulcrum student portal, the separate app that students use. There they build their resume, take the practice test, and sit the AI interview for that role.
Every action the students take, and every result, becomes visible back here, so the placement team can follow progress without asking students for updates.
resume, test, and interview
Each track has three parts. Every part shows figures for the group and a table of individual results, with cut-offs the team can set.
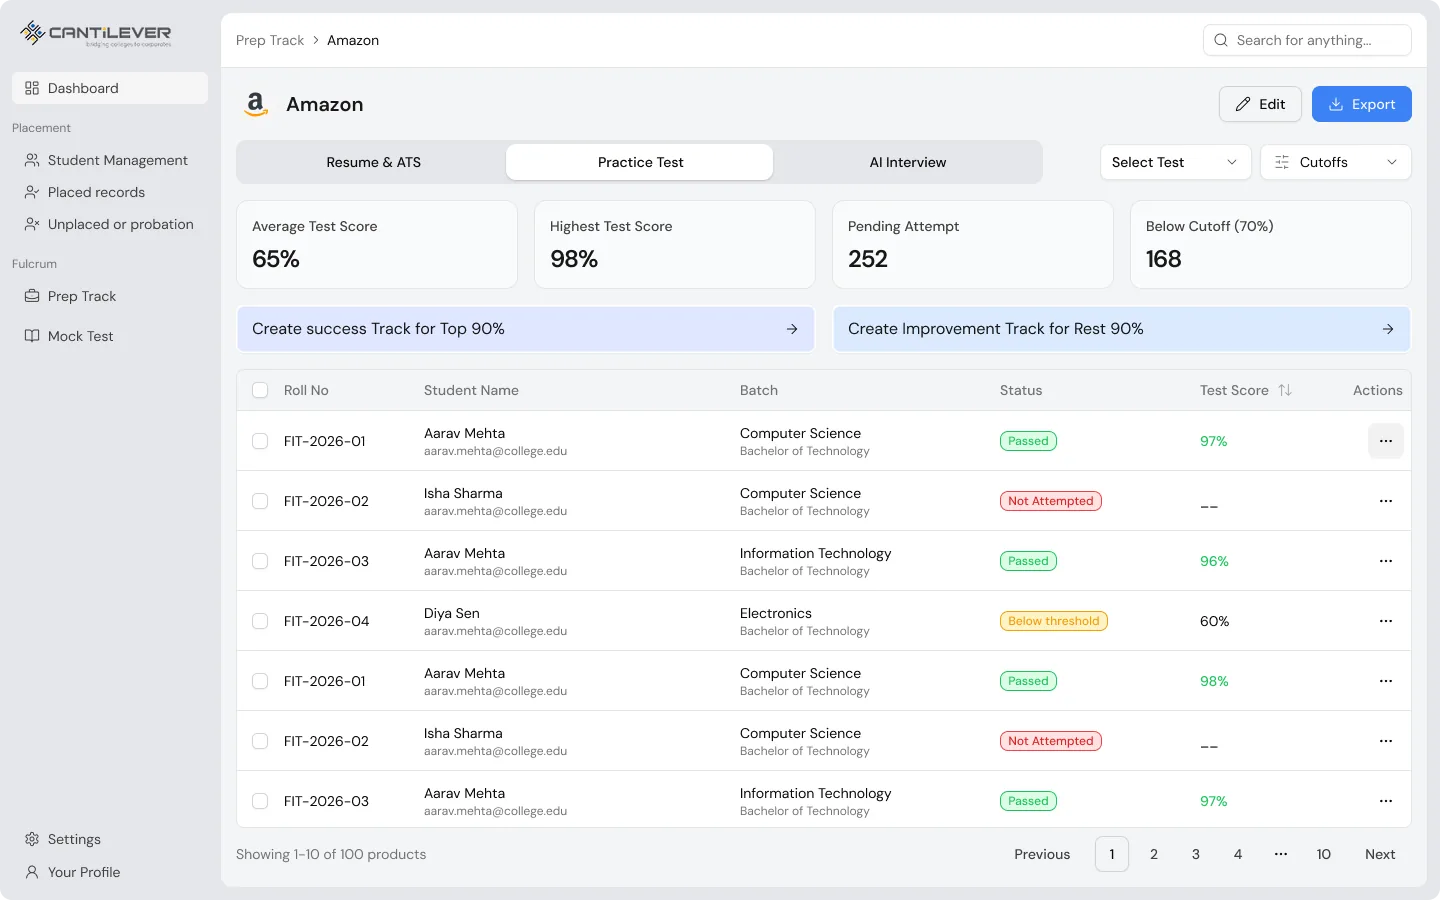
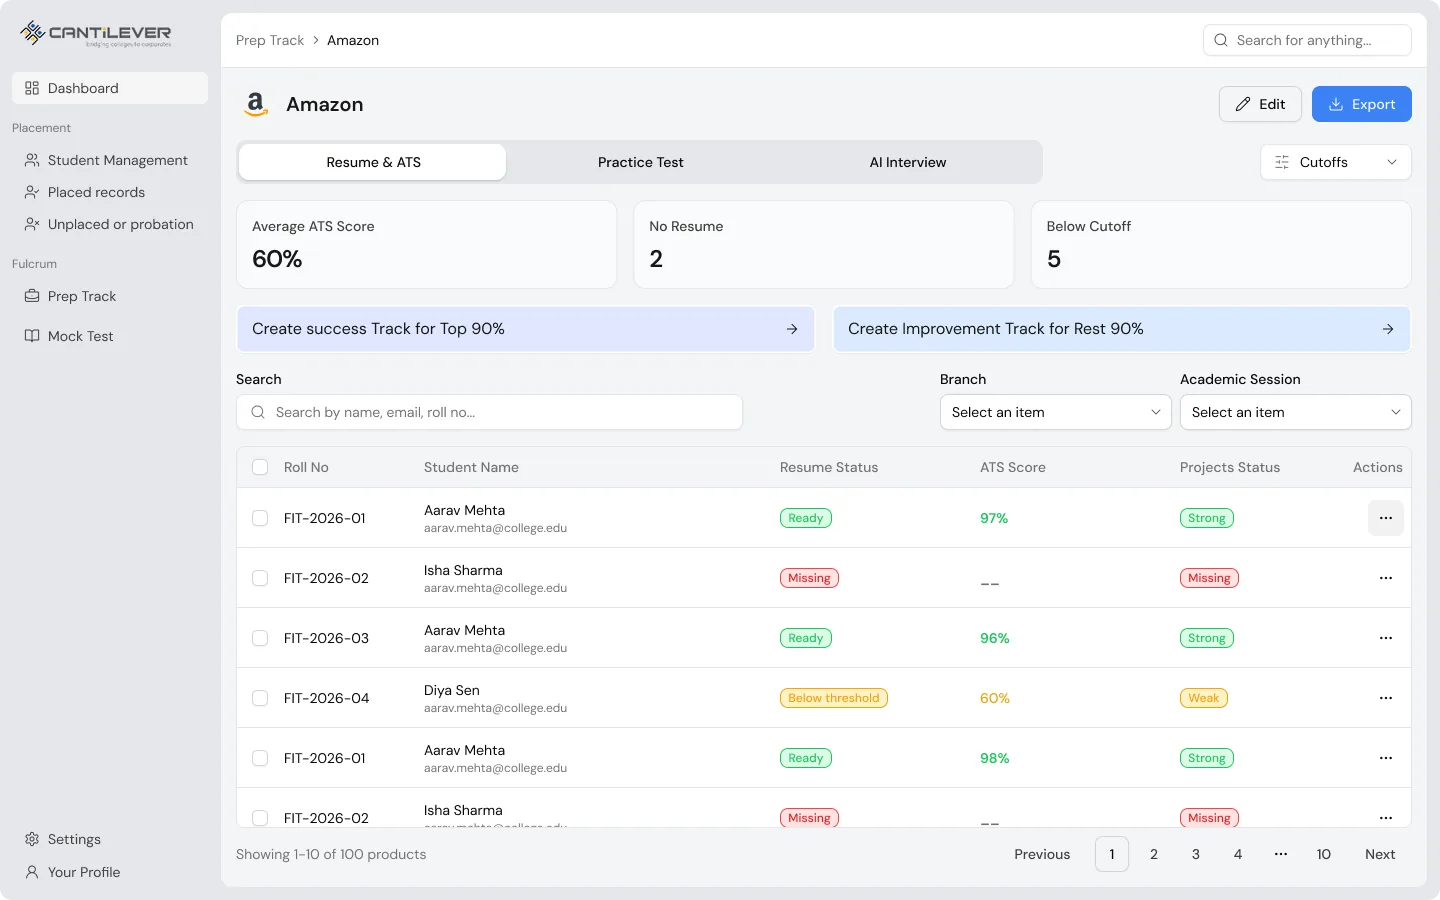
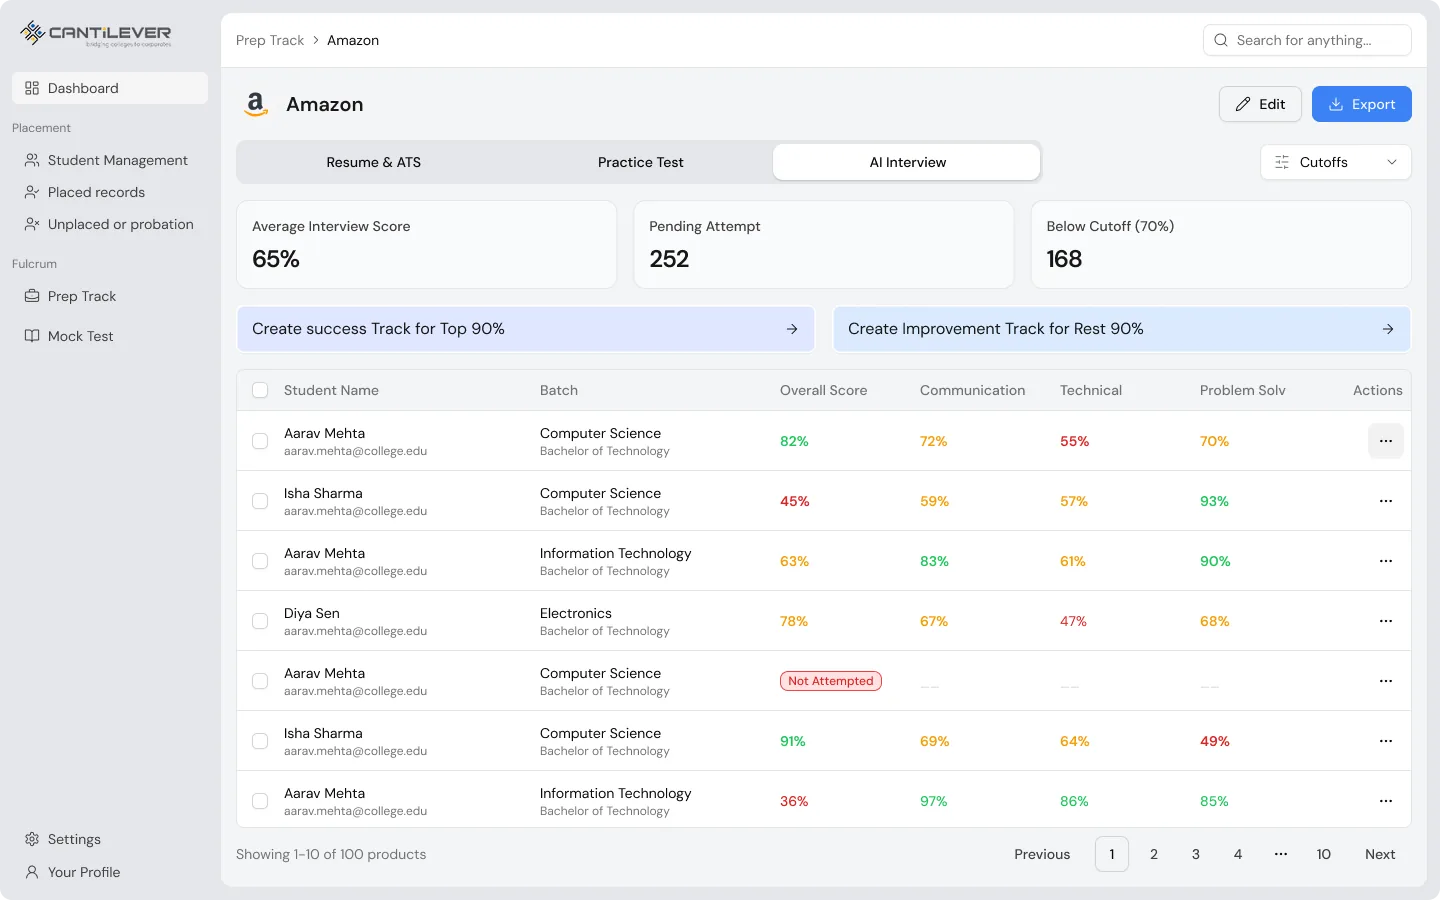
When results are in, the team can split the group in one step. One track extends the students who are ahead, and another supports the students who are behind.
one list of students
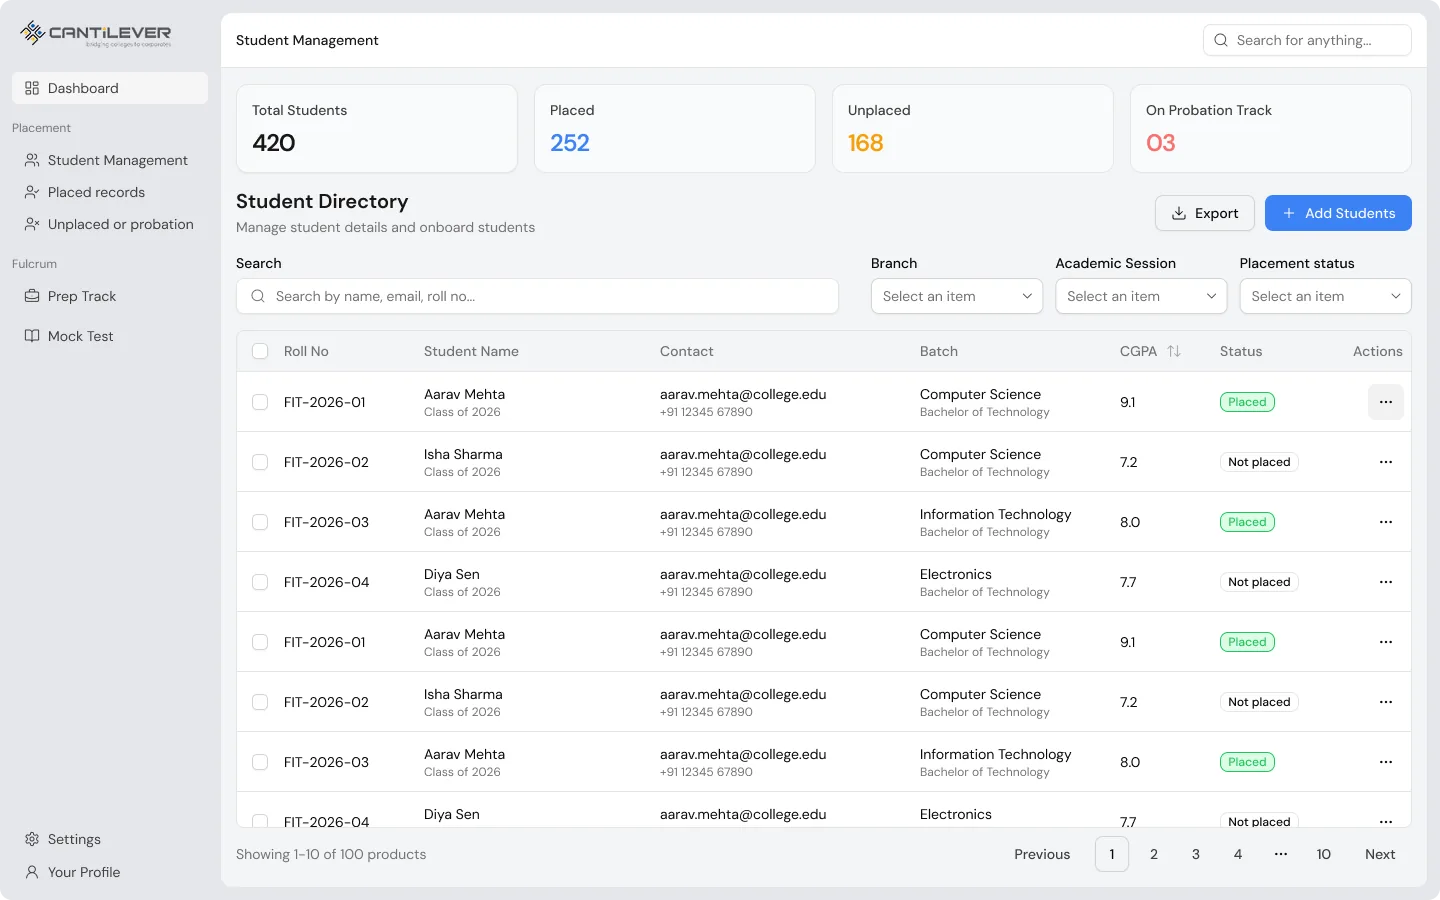
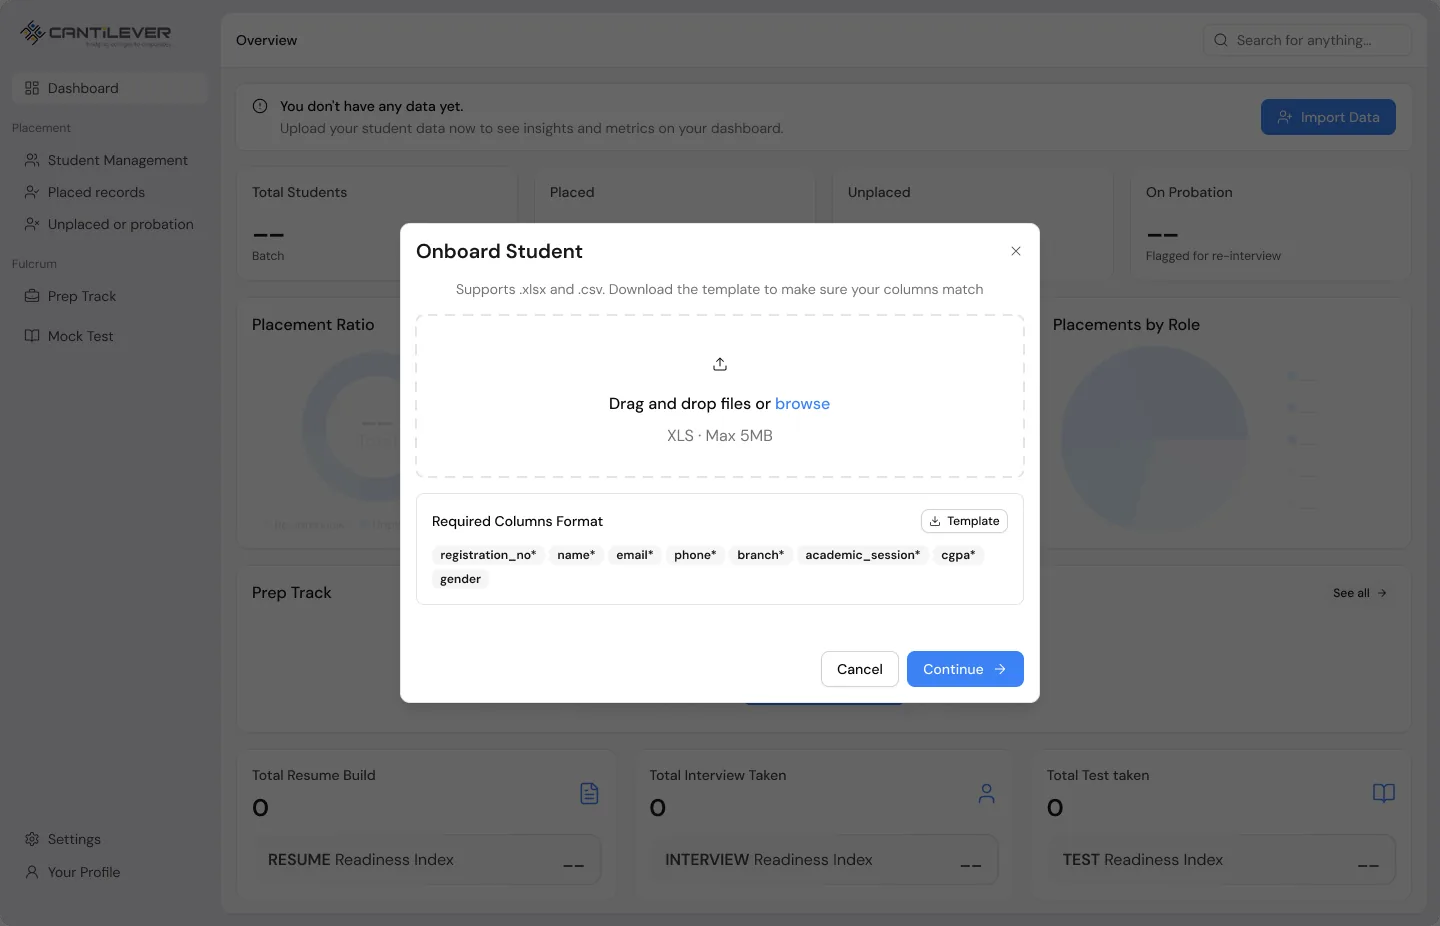
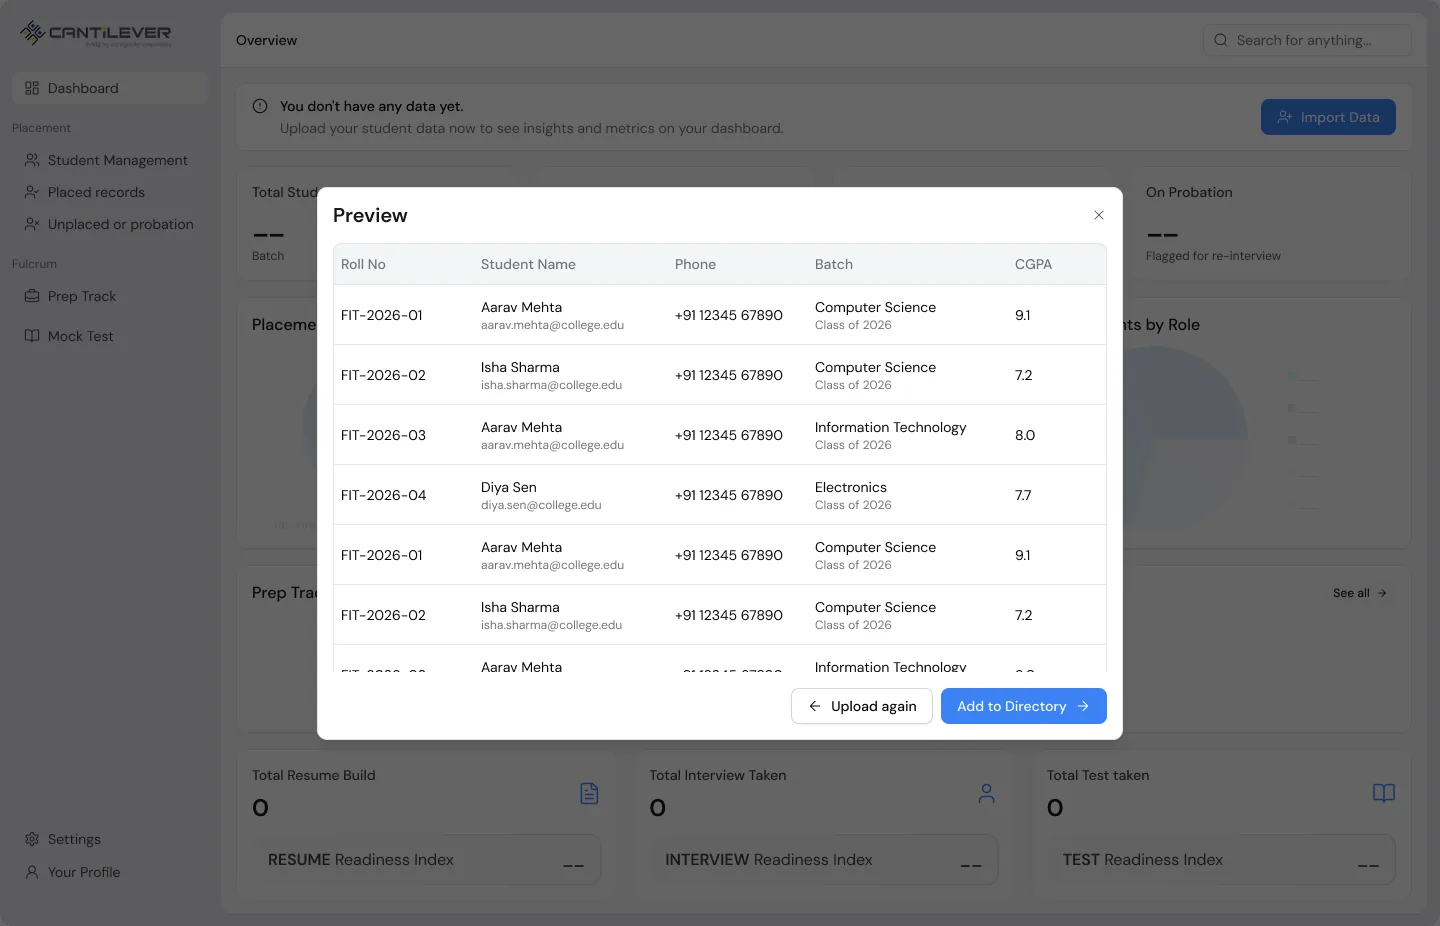
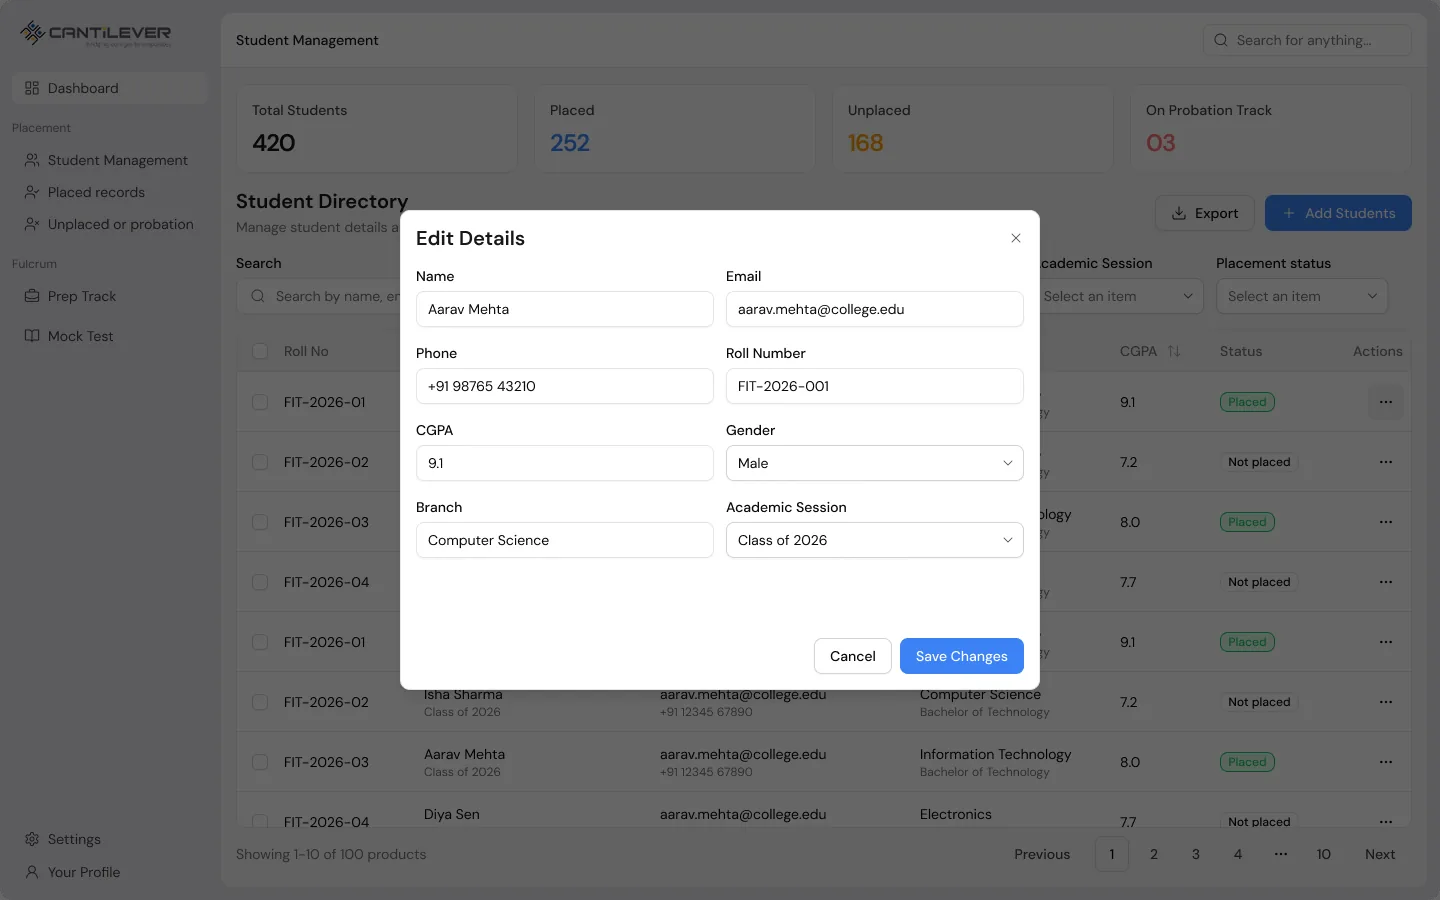
Every student in the batch lives in one directory. It holds their details, resume, and placement status, and can be filtered, exported, and added to.
recording offers
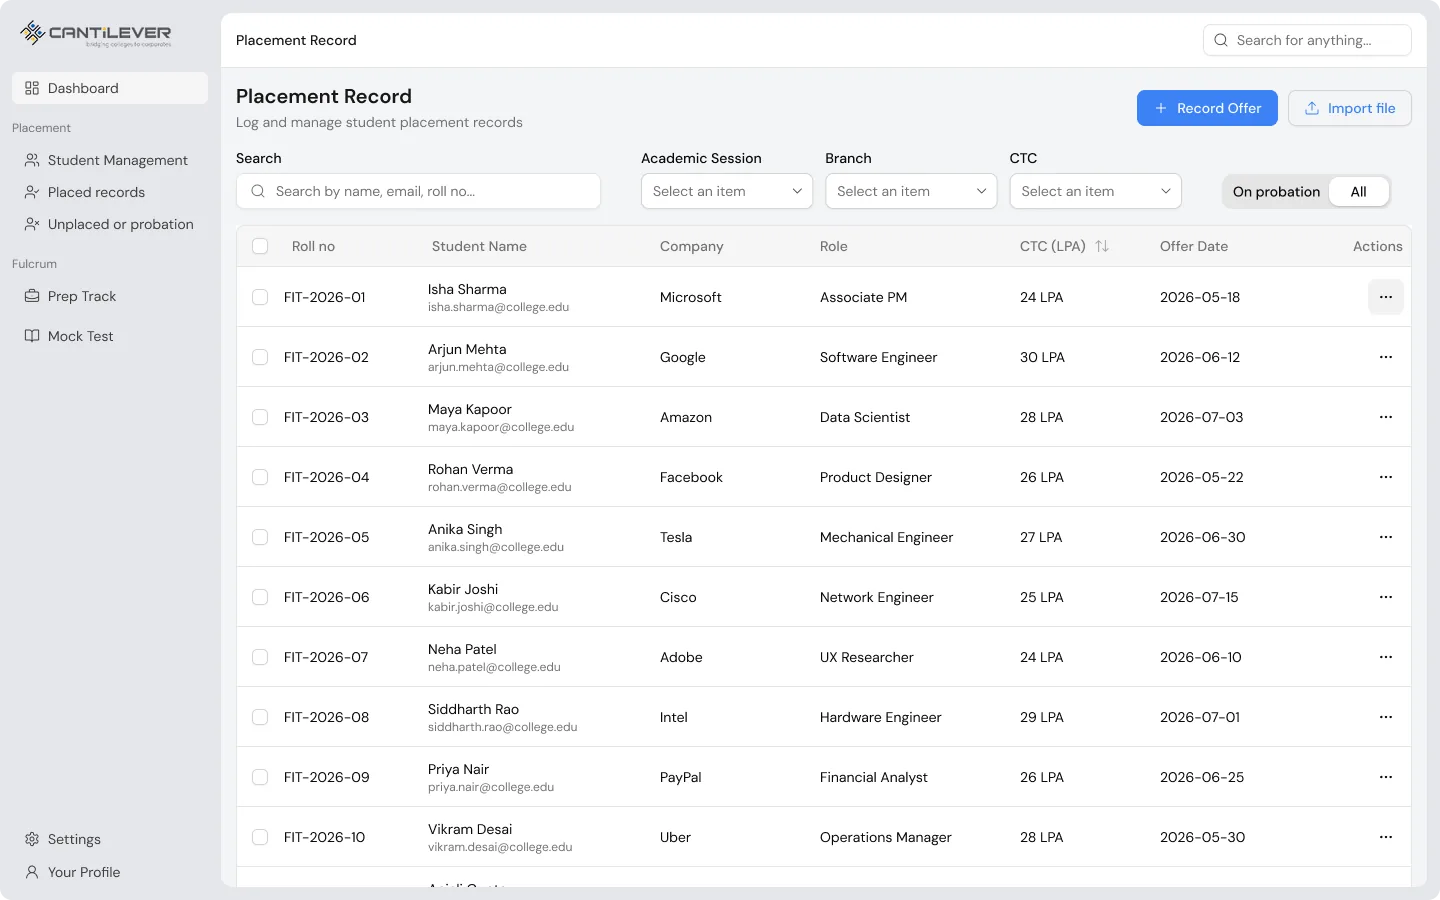
When a student is placed, the offer is recorded with the company, role, package, and date, one by one or by import.
other screens and states
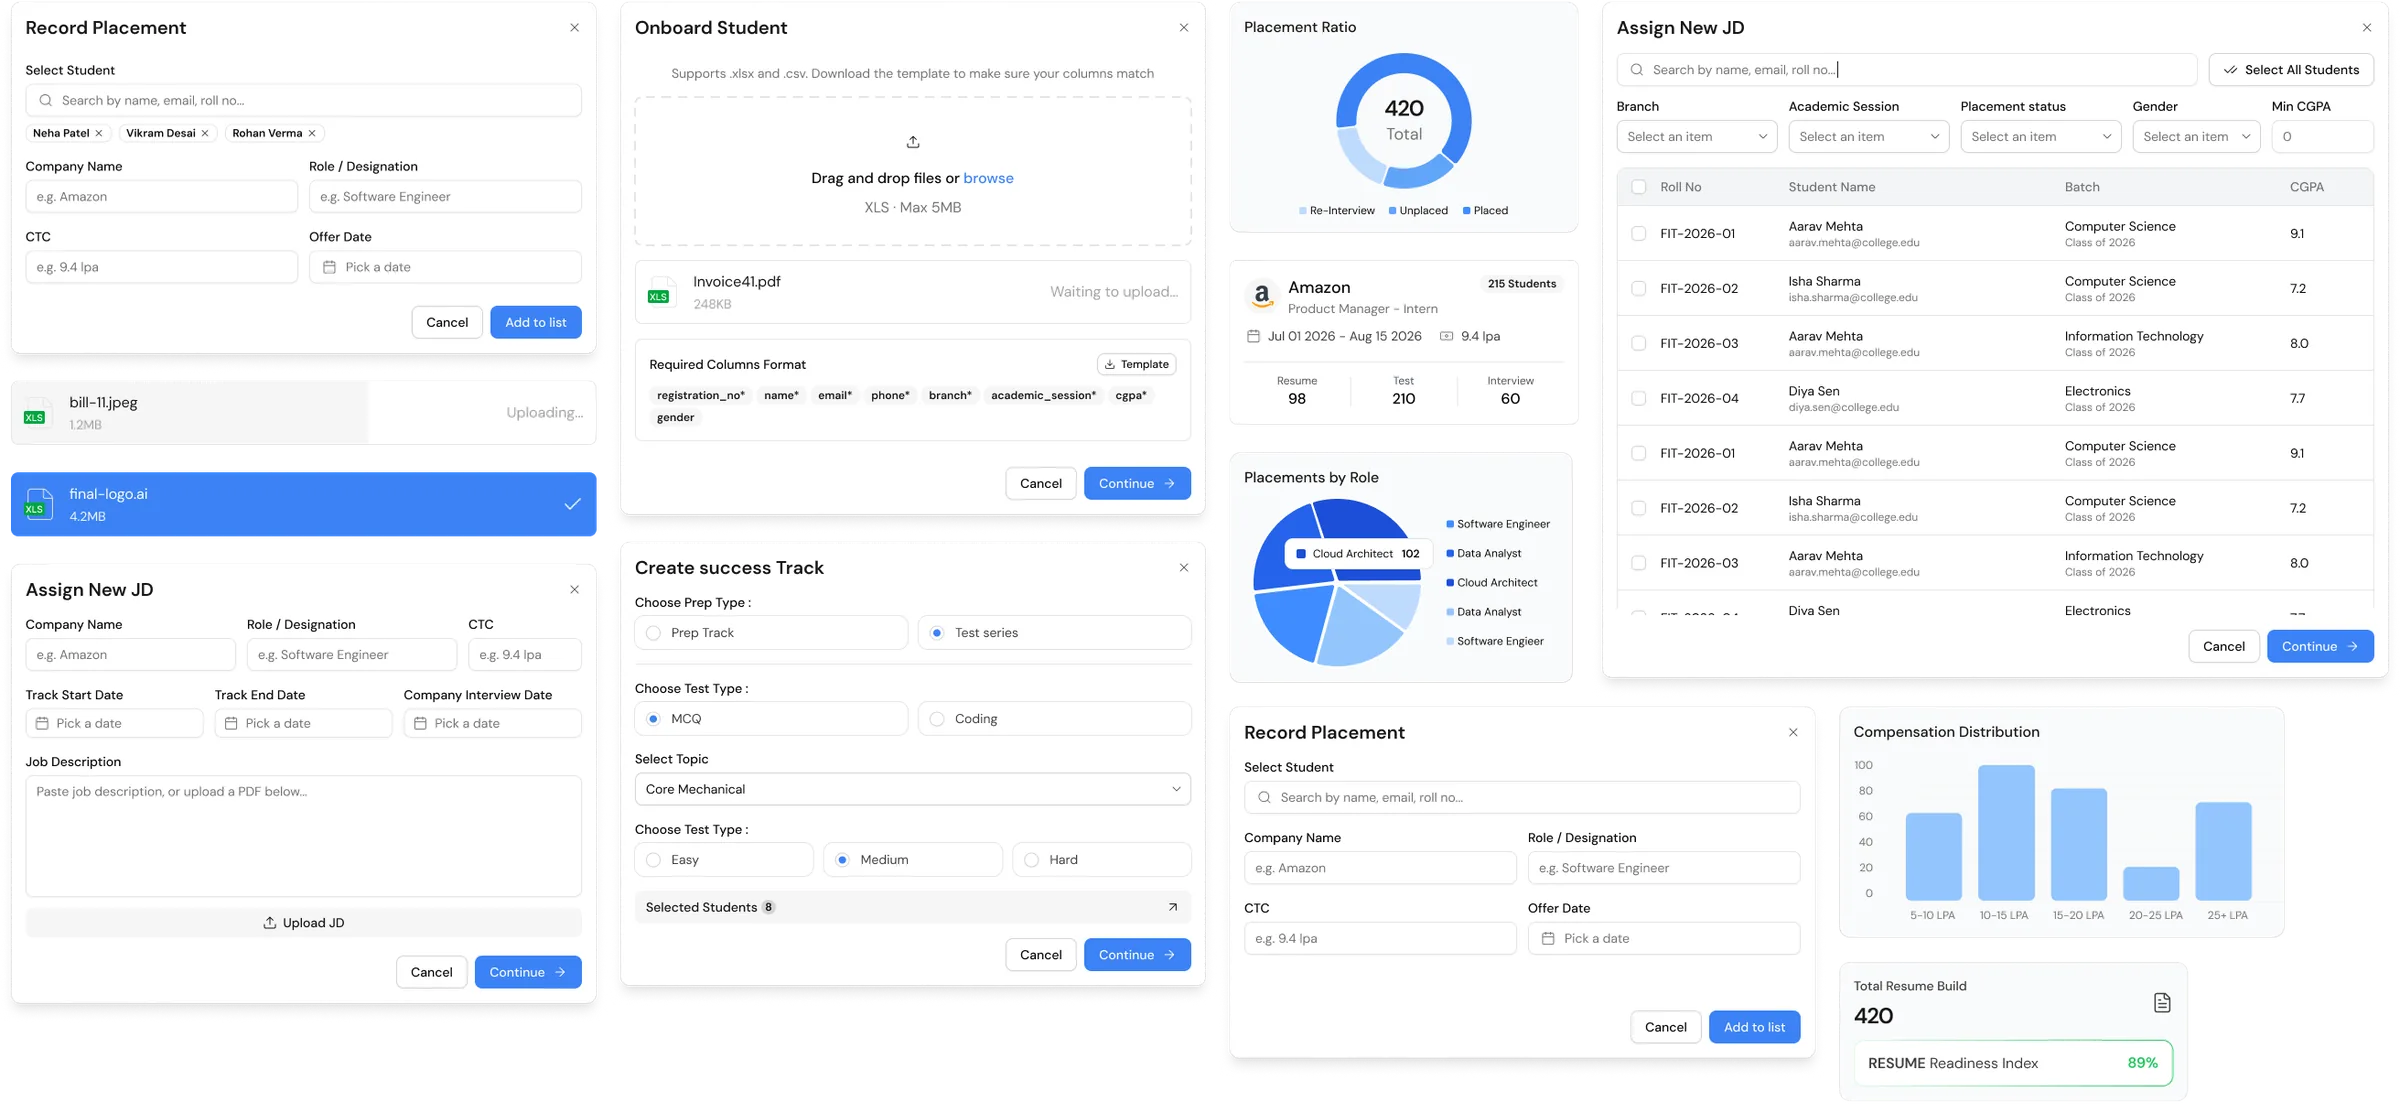
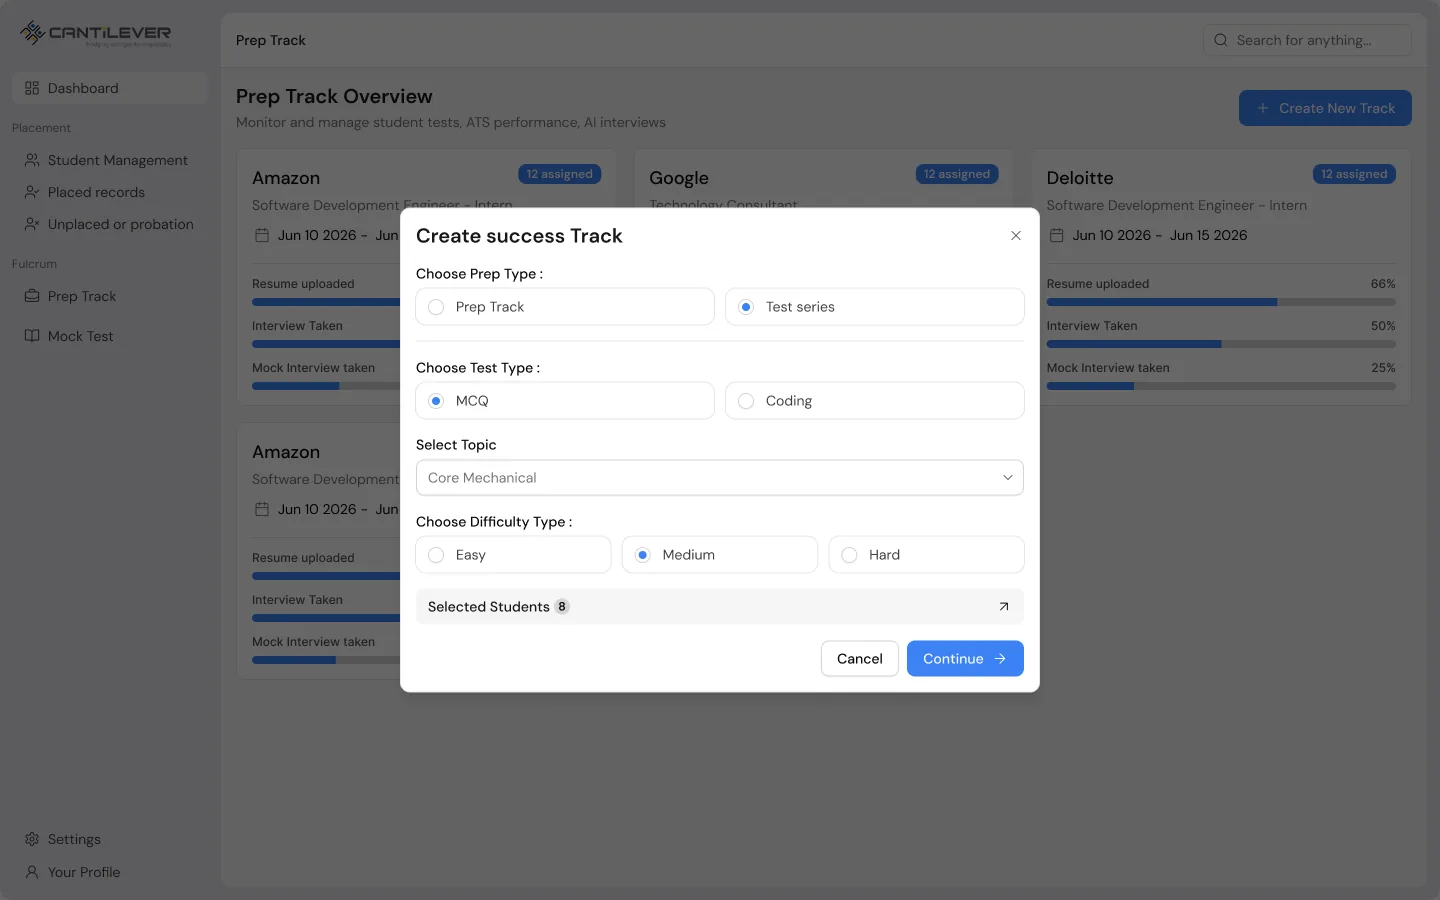
A few of the smaller flows and states from the same set.
what I took away
Designing for a lot of information
The product holds a lot of information. Most of the work was deciding what each screen is for and what the team should do next on it, so the data stays useful instead of overwhelming.
Using a ready design system
I also learned when not to build from scratch. I could have created a new design system for this product, but shadcn was already available, well built, and quick to work with, for the developers and for me. Using it instead of a custom system let us deliver faster without giving up quality.
The wider lesson was to fit the approach to the requirement, and to reach for a ready solution when it serves the goal better than building a new one.